")

By Dylan Wilks, CTO
Introduction
Most of those involved in cannabis and hemp recognize that the cannabinoids are not evenly distributed across the plant. The inflorescence, or flower, typically contains the highest concentration of cannabinoids. This is can be a blessing or a curse, especially in the hemp world. With hemp, THC levels are higher along with CBD levels in the flower. That means sampling the same way every time is important (Hint: find out how your local regulators will sample and copy that!) Regardless, much less focus has been placed on other parts of the plant. Are there cannabinoids in stems and stalks? There have been plenty of anecdotal reports indicating that cannabis stems can contain rare cannabinoids or other interesting components, so we set out to find the answer using LightLab 3 Cannabis Analyzer.
Procedure
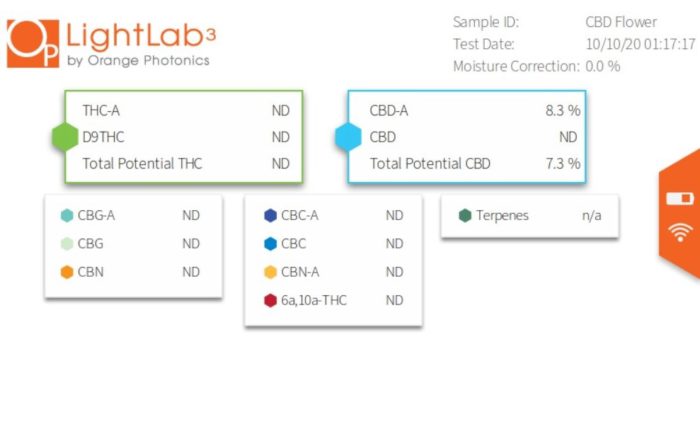
We gathered stems from a THC dominant and CBD dominant plant. Before testing the stems, we wanted to get a baseline of the flower material, so we ran that first. The findings are shown below, with typical flower results. The THC dominant sample did display some D9THC, which is probably an indication that the plant was cured under higher heat or is an older sample. It also showed a small amount of CBGA, which likely means it was harvested just a bit too early.

After running the flower material, we then prepared the stems. We focused on larger stems so we would have plenty of testing material. Each stem was cleaned under a microscope of any lingering leaf material. While under the microscope, we also gathered some pictures of what the stems looked like. Interestingly, you can see some hairs on the stems that look suspiciously like trichomes, but without the full head. That made us think there should be at least some cannabinoids in the stem.


After cleaning, we chopped the stems into approximately 2mm pieces. We weighed 500 mg of sample and shook with 10ml of LightLab solvent for 2 minutes. For those of you that are LightLab users, that will give a 5x improvement on our 0.5% detection limit for flower material (0.1%). The LightLab 3 we used included the Minors module, so we were able to screen for 11 cannabinoids plus a semi-quantitative terpene analysis.
Results
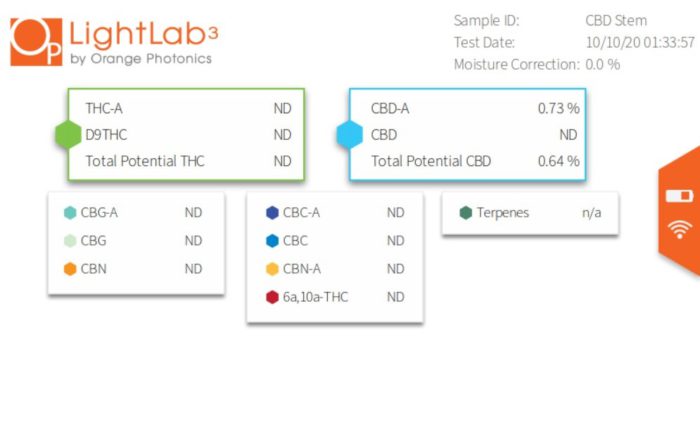
The stem analysis came back a little unexciting. No interesting minor cannabinoids were detected. The THC dominant stem returned THCA and D9THC at levels above 0.1%. The CBD dominant stem returned only CBDA. Both plants have a cannabinoid profile that mimics the original flower material.

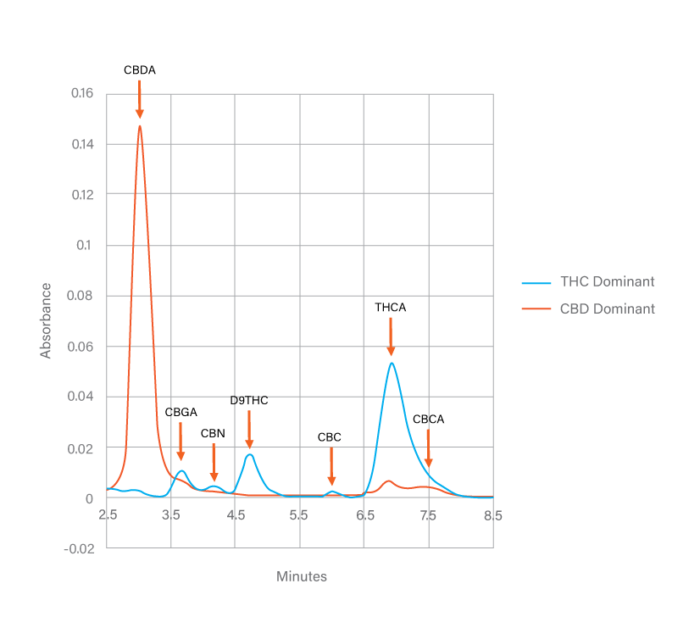
With LightLab 3 we can also look at the chromatograms for the samples to check for minor cannabinoids that might be present below the detection limit. The THC Dominant sample showed a fair number of other cannabinoids: CBGA, CBN, D9THC, CBC and CBCA were all present in small amounts. In the CBD dominant sample, trace amounts of THCA, CBCA and CBGA were present, but interestingly no CBC or CBD were present. The trace cannabinoids that showed up in the stem were also present in the flower chromatograms.
Conclusion
The stems of both CBD and THC dominant samples didn’t contain any exciting unknown cannabinoids, and for the most part, mimicked what the flower samples showed. It’s clear that the levels of cannabinoids are quite low on the stems, but not zero.
Our best guess is that the hairs on the stems are underdeveloped trichomes that tend to still have small amounts of cannabinoids. Sadly, nothing earth shattering here, but still it’s interesting to see that most parts of the plant do in fact generate cannabinoids. Stay tuned for future tests we have planned on cannabis roots and other parts of the plant.