The Extraction Kinetic Curve
By Jesse Turner, Director of R&D at Green Mill Supercritical
Abstract
As the cannabis industry continues to mature, competitive advantages come, more and more, through efficiencies that lead to selling more product, creating better quality products, and achieving greater profit margins. From a supercritical CO2 extraction (ScCO2) standpoint, understanding the dynamics at play during an extraction is important for maximizing efficiency and throughput. One key concept of ScCO2 extraction is the kinetic curve. The kinetic extraction curve is a mass transfer dynamic that provides information on the rate of solubilization and recovery of target compounds. It is key in determining how efficient an extraction is.
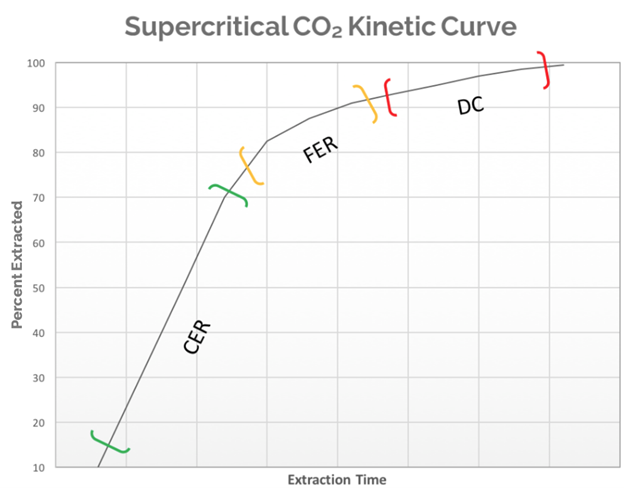
In picture #1 a hypothetical extraction curve is modeled. This model assumes the biomass has been ground to a consistent particle size and homogenized prior to extraction. The curve will go through three distinct phases with different extraction dynamics in each. The first is the Constant Extraction Rate (CER), which is the portion of an extraction where the majority of the target compound is on the particle surface. This means that the supercritical CO2 has easy access to those compounds and the extraction rate will be limited by the amount of solvent coming into contact with the biomass. The extraction rate in this phase will be at the highest point it reaches for the entire extraction run, as the solvent is saturated with the target compound at the maximum ratio of solvent to solute based on the specific extraction conditions. The CER portion is a relatively linear phase as it is regulated by the amount of solvent passing through the biomass.
The next portion of the curve is the Falling Extraction Rate (FER). At this point, the easily accessible target compounds are rapidly being depleted and the solvent is now diffusing into and out of the particles within the biomass to solubilize the target compounds. This diffusion takes time. The overall extraction rate has dropped and will continue to drop as the extraction continues.
Finally, the Diffusion Controlled (DC) portion of the curve is the final phase in a cannabis extraction. At this point, all the easily accessible target compounds are entirely depleted and what remains are small quantities buried deep within the particles. During this phase of the curve the time spent chasing the last few grams of extract becomes highly inefficient. A well-optimized extraction method should avoid spending as much time as possible in this phase. This experiment will attempt to produce a kinetic extraction curve using both mass yield over time and HPLC analytics to plot out the data that will generate the extraction curve.
Methods
The testing consisted of a single extraction conducted on 1.6kg of cannabis biomass. An initial light volatile oil extraction was conducted to remove the terpene and terpenoid compounds prior to the material being decarboxylated. The material was decarboxylated at 210C for 2.5 hours. The decarboxylation step was used to convert the tetrahydrocannabinolic acid (THCa) into delta(9)-tetrahydrocannabinol (D9-THC). This conversion increases the solubility of the target compounds in ScCO2. After decarboxylation the material tested at an average of 7.33% D9-THC in the homogenized biomass.
The extractions were conducted using a 7.5L Green Mill Supercritical ScCO2 system with in-line winterization capabilities for the removal of plant waxes. The collect system consists of three vessels with the ability to set individual solvent densities to fraction different components off during an extraction. For this experiment, all three collections were combined. The extraction vessel (EV1) conditions were set to 2200psi at 55C. This produces a solvent density of 0.659 g/mL and minimized the co-extraction of undesirables. The flow rate was set to a static 400 g/min and the total extraction time was 300 minutes. The total mass yield was collected and recorded every 60 minutes until the extraction was completed. Each collection had a sample of the oleoresin pulled for analysis by HPLC in triplicate using the LightLab Cannabis Analyzer by Orange Photonics. The results were then averaged to determine the D9-THC concentration in each sample. Additionally, the decarboxylated biomass and raffinate were also analyzed in triplicate.
Equipment
- Green Mill Supercritical 7.5L SFE Pro ScCO2 extraction system
- Green Mill Supercritical Real-Time Winterization plant wax removal module
- LightLab 3 Cannabis Analyzer HPLC by Orange Photonics
Results
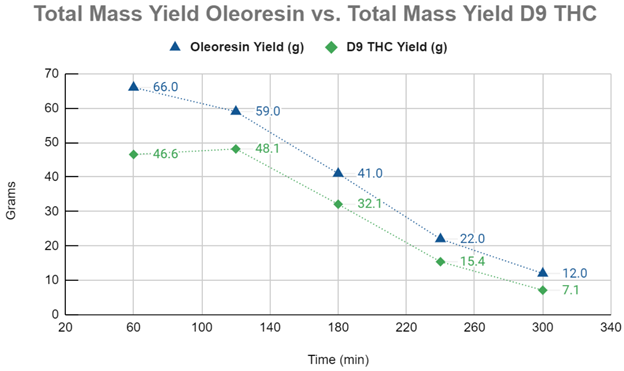
Graph #1 compares the mass yields (g) of the raw oleoresin to the mass yields (g) of D9-THC. The first 60 minutes of the ScCO2 extraction appears to demonstrate compounds with a higher degree of solubility than D9-THC being extracted and diluting the concentration of the cannabinoid in the oleoresin. The kinetic extraction curve modeled from the D9-THC yields demonstrate a CER up to at least 120 minutes into the extraction, with the FER phase starting after that and continuing until 240 minutes, at which point the extraction appears to enter the DC phase of the curve.
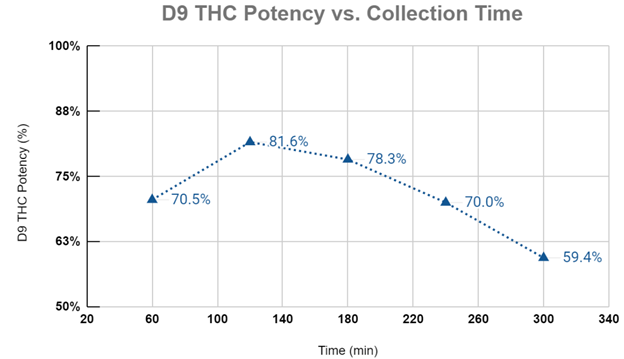
Graph #2 plots the D9-THC purities for each collection period during the extraction experiment. Again, the first phase of the extraction sees compounds with a higher solubility than D9-THC being preferentially extracted and diluting the overall sample purity for D9-THC. The cannabinoid potency peaks at 120 minutes corresponding with the end of the CER stage and begins to fall thereafter. As the extraction progresses into the FER and DC phases, the shift in mass transfer dynamics gives other compounds (less soluble than D9-THC) the ability to become solubilized, which in turn reduces the overall purity of the extract.
Conclusions
The data from this experiment clearly demonstrates adherence to the kinetic curve model for botanical compounds in supercritical carbon dioxide. The extraction of D9-THC followed the progression from Constant Extraction Rate (0-120 minutes) to the Falling Extraction Rate (120-240 minutes), and finally finishes in the Diffusion Controlled phase (>240 minutes). Upon completion of the extraction, the raffinate was homogenized and analyzed in triplicate using the LightLab in “Raffinate” mode. All three samples came back as ND, meaning the material had no detectable D9-THC.
This data can be invaluable to a cannabis or botanical processor as it allows the extraction run time to be determined based on the data curve rather than operator guesses or prior experience. As an extraction system can often become the bottleneck for processors, maximizing extraction efficiency can be consequential. Modeling the kinetic extraction curve and conducting analytics on the starting material, oleoresin and raffinate, can ensure maximum process efficiency. In this experiment, the time estimated for a nearly complete extraction was six hours. In reality, a processor may choose to forgo the last 60 minutes of an extraction. While this will leave 7.1g of D9-THC behind, it frees up an additional hour of time on the system that can be used on fresh, unextracted material. Additionally, this curve allows the processor a powerful tool for method development.
The experimental conditions for the test above manipulated the solvent density to produce a higher quality oleoresin. Higher throughput could easily be achieved by increasing the solvent density, adding pressure or lowering temperature, or through manipulation of the D9-THC vapor pressure dynamic above the pressure cross-over region. With the increase in solubility a new curve could be plotted that would provide information on the required extraction run time. If a processor increases cannabinoid solubility but does not subsequently decrease the extraction time, efficiencies are being lost.
Another way in which this curve can be utilized is to create a rough extraction run time calculator. This would require producing this curve on “low” cannabinoid content trim (<10% w/w), “medium” cannabinoid content biomass of any type (10-15% w/w), and lastly one on “high” cannabinoid content flower (>15% w/w). Each test extraction would determine the optimal run time for the three cannabinoid levels of biomass. These run times would be plotted on a graph of cannabinoid concentration versus time, used to create a trendline, and a slope equation that would then be generated. If the starting material’s potency is known prior to extraction, this slope could be used to determine the general extraction run time of new biomass. This can help maintain efficiency during the normal production cycle, outside of method development, when it becomes impractical to create an extraction curve. To achieve this efficiency requires analytical data on all biomass prior to extraction. This would be incredibly time-consuming and prohibitively expensive if conducting analysis through the 3rd party analytical labs available in the cannabis or hemp industry.
The extraction mass yield curve, backed by analytical data, can be a powerful tool for cannabis, hemp, and other botanical processors. The data provided allows for efficient extraction methods to be developed. These methods will optimize extraction times and compound solubility, as well as increase the overall throughput while minimizing the possibility of over or under-extracting the biomass — all things that hurt the processor’s bottom line. The alternative is extracting “blind,” utilizing a single method for all extractions, with only previous anecdotal knowledge used to determine the proper method and extraction time.
In a comparison of these scenarios, processing teams that utilize an inexpensive solution like the portable HPLC, LightLab 3 Cannabis Analyzer, can quickly analyze the cannabinoid content of biomass, oleoresin, raffinate, and finished product. By collecting necessary data and minimizing the guessing game through a kinetic extraction curve, stronger business plans can emerge.
References
Cavalcanti, R., & Meireles, M. (2012). Fundamentals of Supercritical Fluid Extraction. Comprehensive Sampling and Sample Preparation, 117-133. doi:10.1016/b978-0-12-381373-2.00039-9
More about Green Mill Supercritical